


I discovered this amazing IntelliJ feature after 6 years.
How a random debugging session helped me discover this amazing feature.


I used IntelliJ IDEA for the first time in 2018. I had only heard about eclipse in my college days, and the start was challenging.
Fast forward 6 years, and I have been using IntelliJ IDEA almost every day at work, writing Java code, debugging it, and building cool things.
However, very recently I was trying to debug an issue where the logs were only visible in Athena. I was trying to understand the issue, and my teammate came to my desk to try to help me. He asked me why I was not analysing the stack trace in IntelliJ.
I could not understand what he meant, and then what he did next was just an amazing moment for me.
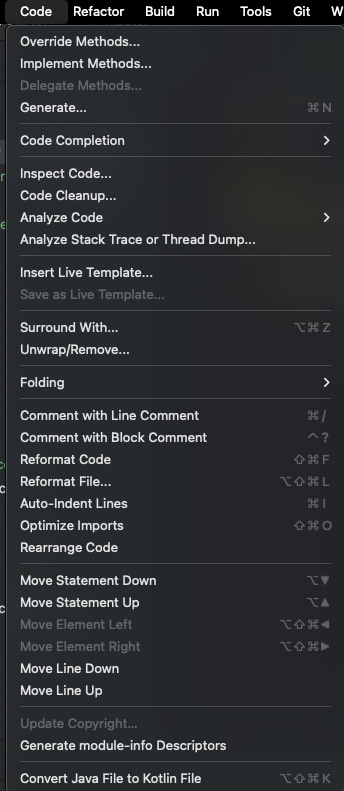
He just copied the stack trace. went to Code→ Analyse Stack Trace or Thread Dump and copied the stack trace there.
It just unscrambled the stack trace and made it very easy for me not navigate the code base.
So next time you get a logs from the email, slack or any debugging you are doing just do the following steps
In the main menu, go to Code | Analyze Stack Trace or Thread Dump.
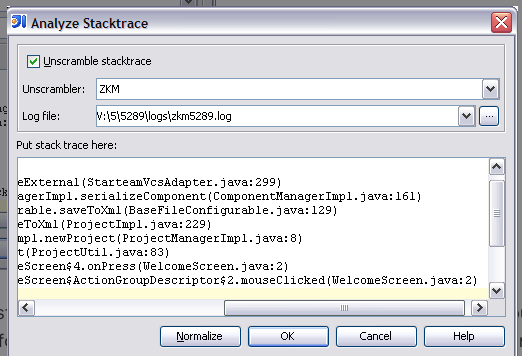
In the Analyze Stack Trace dialog that opens, paste the external stack trace or thread dump into the Put a stack trace or a complete thread dump here: text area.
Specify whether you want to have the stack trace unscrambled.
To do that, select the Unscramble stack trace checkbox, select the desired unscrambler and log file.
If the stack trace text is corrupted (lines are cut or wrapped, or too long, and so on) after processing with some software (for example, a bug tracker or a mail client), click Normalize.
Click OK. The stack trace is displayed in the Run tool window.
To jump to the code that caused the problem, scroll to the stack trace line you need and click the link to the source file. The file opens in the editor.

Why Is This Feature So Valuable?
Time-Saving: No more manually searching through files. The tool instantly highlights the exact location in your code.
Increased Productivity: Spend more time solving the issue rather than locating it.
Error Tracking: Helps in quickly understanding and reproducing bugs, making debugging a much smoother process.
If you liked this post please do checkout my other posts on my profile.
Schedule a mock System Design Interview with me : https://www.meetapro.com/provider/listing/160769**
Linkedin: https://www.linkedin.com/in/mayank-sharma-2002bb10b/
My website : imayanks.com